Performance alerts from Apollo Studio
Performance alerts require a paid plan. They are currently experimental.
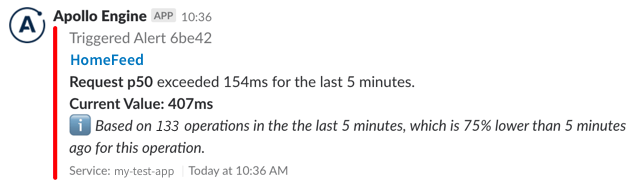
Apollo Studio can notify your team's Slack workspace or Pagerduty instance whenever a particular metric (such as error rate) for a particular GraphQL operation exceeds a defined threshold. This is useful for detecting anomalies, especially following a release.
Supported metrics
You can configure performance alerts to trigger for any of the following metrics:
- Request rate: requests per minute
- Request duration: p50/p95/p99 service time
- Error rate: errors per minute
- Error percentage: the number of requests with errors, divided by total requests
Each performance alert you define can apply to either a specific operation or any operation. If you define an alert that applies to a specific operation, the "any operation" alerts for the same metric no longer apply to that operation (i.e., the more specific alert takes precedence).
Setup
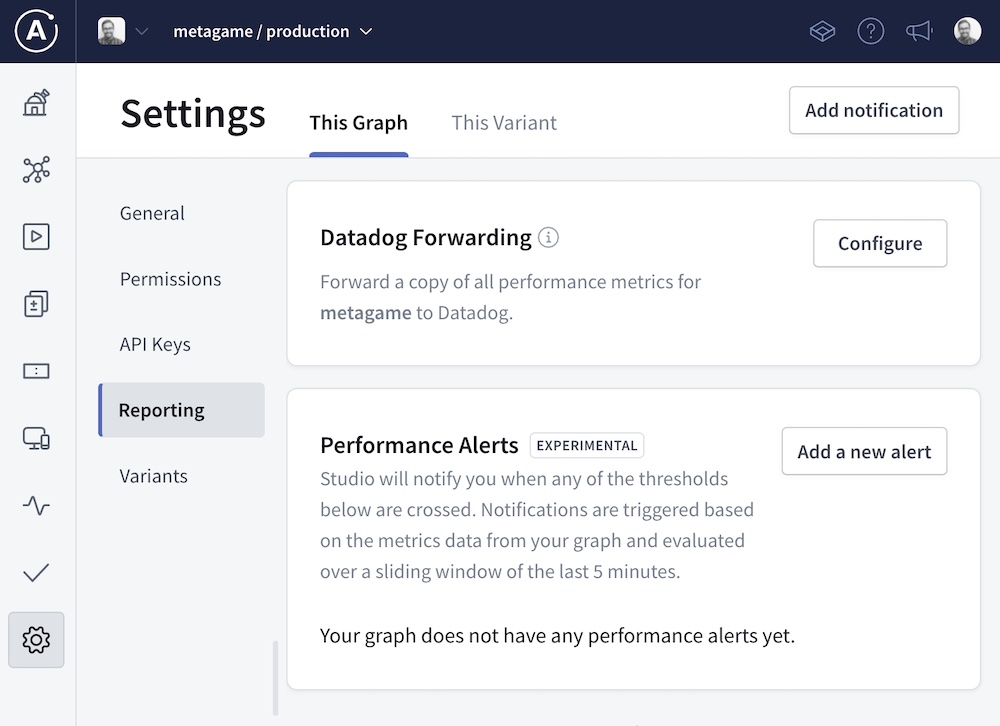
- Go to your graph's Settings page in Apollo Studio.
- Select the Reporting tab.
- Find the Performance Alerts card and click Add a new alert.
- Configure the alert's Operation Name, Trigger, and Trigger Value to suit your needs.
- Select a Channel to send alerts to. You can select New Channel from the dropdown if you haven't yet configured the Slack channel or Pagerduty instance you want to use.
- Click Create.
Threshold window
Thresholds are measured against a rolling five-minute window. For example, let's say you configure an alert to trigger when an operation's error rate exceeds 5%. If 6 out of 100 executions of that operation result in an error during a five-minute period, the alert will trigger with an error rate of 6%. When the error rate falls back below 5%, your notification will resolve.